Every great presentation starts with a conflict. Before you can sell a solution, you must first sell the problem. This is the job of the problem statement slide---arguably the most critical piece of real estate in your deck. It is the hook that convinces your audience that a change is necessary.

Yet, despite its importance, this slide is often the hardest to design. Presenters struggle to balance clarity with depth, often resulting in cluttered bullet points that bore the audience rather than engaging them. In this guide, we will explore how to craft a compelling problem statement and how tools like Diagrimo can transform complex issues into clear, visual narratives.
What Is a Problem Statement Slide?
A problem statement slide is a dedicated section of your presentation that clearly articulates the specific gap, pain point, or challenge your audience is facing. It acts as the anchor for the rest of your talk. Without a clear problem, your solution has no value.
An effective problem statement slide typically includes:
-
The Context: Briefly setting the scene (e.g., "Current market trends show...").
-
The Conflict: The specific issue hindering progress (e.g., "However, efficiency has dropped by 20% due to...").
-
The Impact: Why this matters (e.g., "This results in a $1M annual loss.").
The goal isn't just to inform the audience that a problem exists; it is to make them feel the weight of that problem. Whether you are using a problem statement slide template or building from scratch, the focus should always remain on the gap between the current reality and the desired future.
Why Many Presenters Struggle with Problem Statement Slides
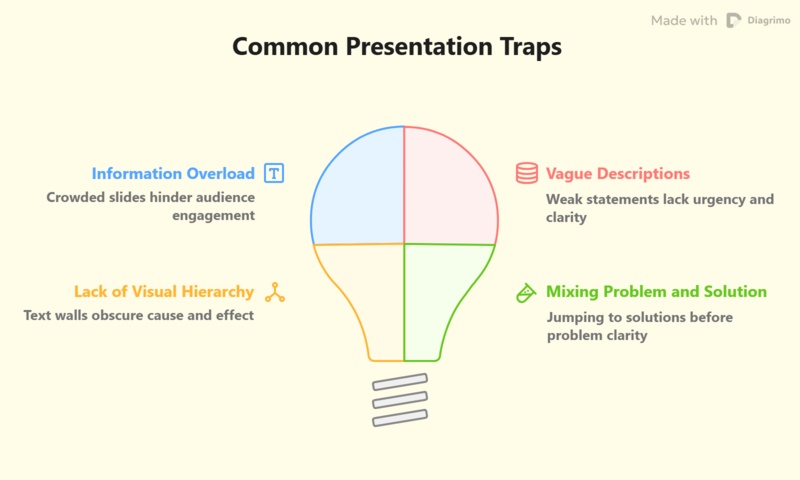
Designing this slide is deceptively difficult. Presenters often fall into a few common traps that dilute their message:
-
Information Overload: It is tempting to list every single grievance. However, a slide crowded with text forces the audience to read instead of listen.
-
Vague Descriptions: Statements like "Sales are down" are weak. They lack the specific data or root cause analysis that drives urgency.
-
Lack of Visual Hierarchy: A wall of text fails to show relationships between cause and effect. A problem statement slide design needs to be visual---showing the "broken" process rather than just telling people about it.
-
Mixing Problem and Solution: Many presenters jump the gun, hinting at the solution before the audience fully grasps the magnitude of the problem.

Finding the right problem statement slide examples to emulate can be hard because every problem is unique. This is where visual thinking tools become essential.
Making Problem Statement Slides Effortless With Diagrimo
If you are struggling to visualize your problem, Diagrimo offers a powerful solution. Unlike traditional slide builders that require you to drag and drop shapes manually, Diagrimo is an AI-powered diagramming tool that converts text directly into beautiful visuals.
Here is how you can transform a text list into a professional slide in three simple steps:
-
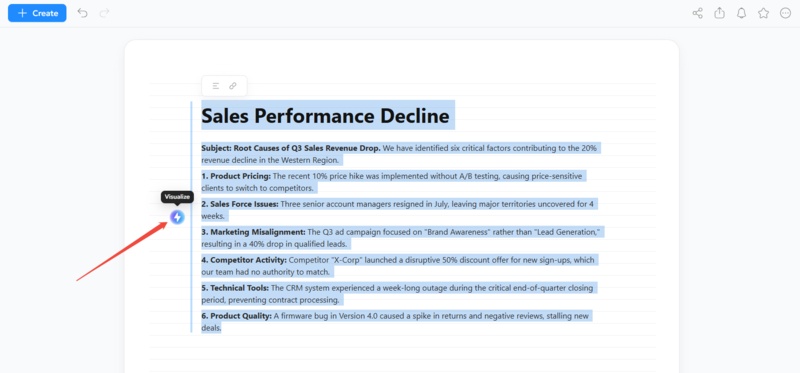
Step 1. Input Your Problem Data
Start by typing your problem description in plain text. As shown in the example, you can list specific root causes such as "Product Pricing," "Sales Force Issues," or "Marketing Misalignment." Simply highlight your text and click the "Visualize" icon.
-
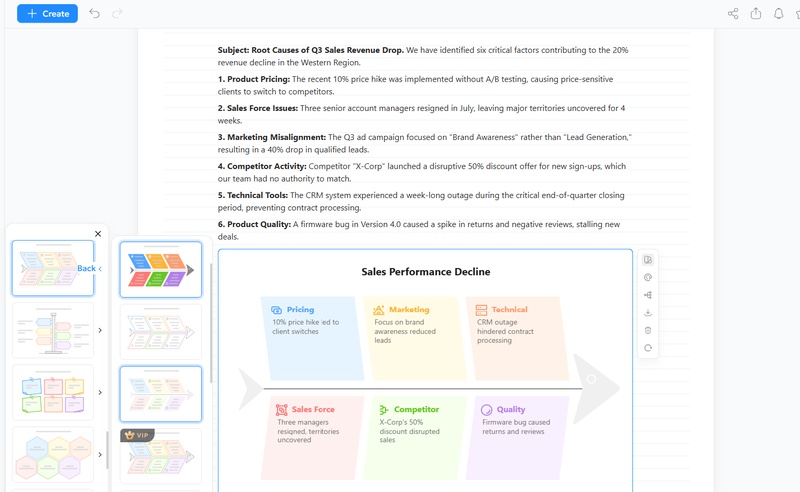
Step 2. Select Your Visual Style
Diagrimo's AI analyzes the logic of your text and automatically generates the most appropriate chart. If the initially generated diagram doesn't match your taste, you don't have to use it. The sidebar offers a variety of alternative layouts and color palettes. You can browse through different styles, ranging from minimalist designs to colorful, segmented blocks, to find the one that best fits your presentation's aesthetic.
-
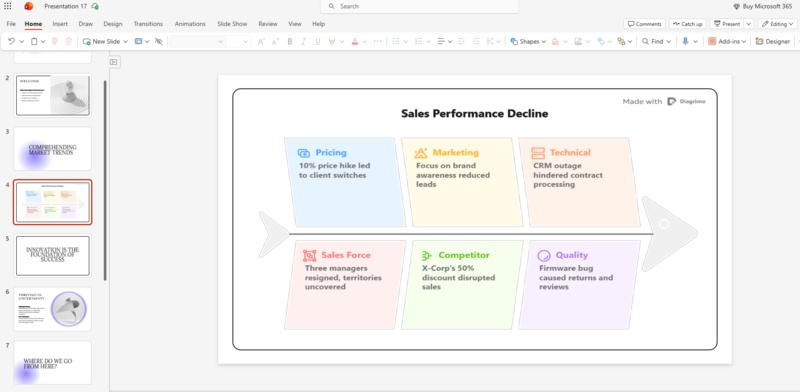
Step 3. Integrate into Your Presentation
Once you have chosen the perfect style, your diagram is ready for the boardroom. Export the visual as a high-quality image and drop it directly into your PowerPoint or Google Slides deck. As seen in the final result, the diagram fits perfectly onto a standard slide, turning a complex problem into a clear, professional visual narrative that is ready to present.


Diagrimo Beyond PowerPoint: Unlocking Its Full Potential
Generating a problem statement slide is just the starting point. Diagrimo expands into a full-cycle content workspace that handles the rest of your project's needs. Instead of switching back to a document editor to write your script or a separate tool to manage files, you can stay within Diagrimo to draft your narrative, polish your text with AI, and generate the remaining diagrams for your deck. It effectively bridges the gap between raw text drafting and final visual production, keeping your workflow contained in one efficient interface.

-
Smart AI Writing Assistant
Highlight text to polish grammar, simplify language, or continue writing, ensuring your narrative is sharp before designing.
-
Instant Text to Diagram
Turn text into visuals quickly. Auto generate Fishbone diagrams, SWOT maps, or Timelines that align with your ideas.
-
Effortless Document Managem
Organize and manage research with team workspaces and folders for easy slide draft control.
-
High Fidelity Exports
Save diagrams as crisp images or PDFs ready for any problem statement slide template.
-
Granular Visual Control
AI Visual Editing lets you customize shapes, strokes, and branches for a personalized design.
Final thoughts
A well crafted problem statement slide is the difference between a presentation that connects and one that falls flat. It requires specific data, a clear narrative, and most importantly, strong visuals. While traditional tools often lead to text heavy slides, modern AI tools like Diagrimo bridge the gap, allowing you to turn complex problem statement slide ideas into intuitive diagrams instantly. By visualizing the pain point, you pave the way for your solution to shine.
- AI text-to-visuals turns ideas into diagrams or infographics.
- Customizable styles match your brand and presentation tone.
- Share anytime by exporting in various formats and a link.
- No design skills needed for presentations, teaching, or reports.

FAQs
-
What is the best chart to use for a problem statement slide?
-
Can I find a problem statement slide template free online?
-
How much text should be on a problem statement slide?
-
Does Diagrimo integrate directly with PowerPoint?
It depends on the problem. A "Fishbone diagram" is great for root cause analysis, while a "Flowchart" works best for process bottlenecks. A simple bar chart is effective for showing quantitative drops (like revenue loss).
Yes, many presentation platforms offer free templates. However, using a tool like Diagrimo to generate a custom diagram and adding it to a blank slide often yields more unique and professional results than a generic template.
Keep it minimal. Use a clear headline, one or two sentences for context, and let your visual diagram or data chart tell the rest of the story.
Diagrimo allows you to export your diagrams as high-resolution images or PDFs, which can then be easily inserted into any PowerPoint or Google Slides presentation.
