Distinguishing between "difficulty" and "complexity" is crucial for student growth. A DOK chart guides educators through Webb's Depth of Knowledge, yet traditional text-heavy grids are often overwhelming. This article explores DOK levels, practical strategies, and how Diagrimo transforms complex theories into appealing and easier-to-understand visuals, making deep learning accessible for everyone.

What Is a DOK Chart?
A DOK chart (Depth of Knowledge chart) is a visual framework used by educators to categorize the complexity of thinking required for a task rather than its difficulty. Based on Dr. Norman Webb's research, a dok education chart breaks down student tasks into four distinct levels of cognitive rigor:
-
Level 1 (Recall & Reproduction): Basic rote memorization, such as listing facts.
-
Level 2 (Skills & Concepts): Using information in a standard way, like organizing data.
-
Level 3 (Strategic Thinking): Reasoning and planning, such as explaining why a phenomenon occurs.
-
Level 4 (Extended Thinking): Complex planning over time, like designing a project.
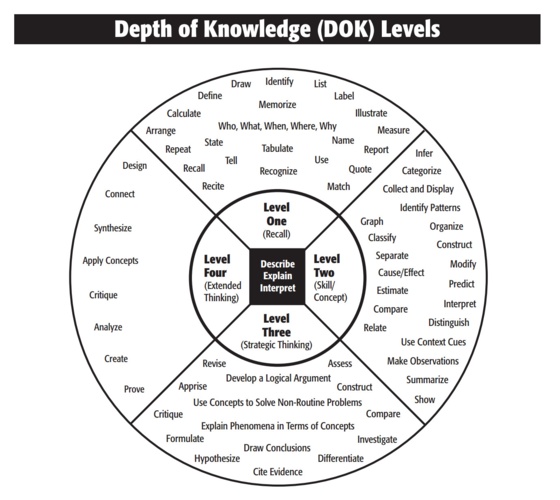

Teachers often use a dok levels chart as a quick reference guide to ensure their lessons are not just difficult but deep and intellectually demanding. While traditional charts are often cluttered with lists of verbs, modern versions aim to be cleaner and more intuitive.
Visualizing DOK Theory to Improve Understanding

Grasping the nuances of cognitive rigor can be challenging when strictly relying on abstract definitions. Visualizing DOK theory is therefore essential for effective professional development, acting as a bridge between complex pedagogy and practical application. Instead of wading through dense training manuals, educators can use Diagrimo to translate these sophisticated frameworks into clear, digestible diagrams.

Diagrimo leverages advanced AI to create appealing and easier to understand visuals directly from simple text prompts. For instance, creating a detailed dok wheel chart no longer requires design skills or hours of formatting. You simply describe your requirements, and the tool generates a structured, professional graphic instantly. This capability is a massive asset for instructional coaches who need to present Webb's framework to staff in a way that is engaging rather than overwhelming.

By offloading the visual layout to AI, Diagrimo allows educators to focus entirely on the content. The tool's smart design makes the progression from simple Recall to complex Extended Thinking intuitively clear. It effectively transforms dry educational theory into a vibrant visual map that teachers can immediately apply to their lesson planning.
Why DOK Charts Matter for Deeper Learning
DOK charts serve as a vital GPS for learning depth in any curriculum. Without a clear visual guide, it is all too easy for educators to fall into the trap of confusing difficulty with rigor. Difficulty simply refers to the amount of effort or work required, such as answering 50 simple math problems that are all Level 1. In contrast, rigor refers to the complexity of thinking, like creating just one new math problem to solve a specific real world issue, which pushes the task to Level 3 or 4.
A well designed dok levels chart transforms abstract standards into actionable strategies. It helps educators achieve three critical goals to support student growth.
- Align Assessments:
The chart ensures that tests match the true cognitive level of the standards. If a curriculum aims for critical analysis but the assessment only covers basic definitions, the data will be misleading.
- Plan Instruction:
Visualizing DOK levels helps teachers verify that students are not stuck at Level 1 or 2 all year. It allows for a strategic progression where lessons build from basic facts to complex reasoning over time.
- Facilitate Discussion:
These charts provide a shared language for students to understand their own learning goals. When students can see where their tasks fall on the spectrum of rigor, they become active partners in their own education rather than passive recipients of information.
Practical Uses of Webb's DOK
Webb's Depth of Knowledge framework transforms lesson planning by moving students beyond simple memorization into complex reasoning. Teachers across all disciplines use the framework to ensure assignments cover the full spectrum of cognitive rigor. Here are specific examples of how DOK is applied in key subjects:
- Mathematics Applications
In math, rigor is often confused with difficulty. A dok chart for math clarifies that solving fifty simple addition problems is still just a Level 1 task. Real usage involves pushing students toward Level 3.
-
Level 1 Example: Calculate the area of a rectangle using a given formula.
-
Level 3 Example: Design a garden with a specific area and justify the shape chosen based on cost efficiency.
-
-
English Language Arts
Teachers use the dok education chart principles to shift focus from basic reading comprehension to deep literary analysis.
-
Level 1 Example: Identify the main character in the story.
-
Level 3 Example: Analyze how the author uses a specific metaphor to change the mood of the chapter.
-
-
Science and Social Studies
In these subjects, the goal is to move from defining terms to conducting investigations. Educators often use a dok question chart approach to prompt deeper inquiry during lab work or historical analysis.
-
Level 1 Example: Define the term photosynthesis or list three dates from the Civil War.
-
Level 4 Example: Design an experiment to test plant growth under different light conditions or analyze multiple primary sources to construct an argument about the causes of a war.
-
Final thoughts
Mastering Webb's Depth of Knowledge prioritizes understanding student thinking. Whether using a standard dok levels chart or a custom dok wheel chart from Diagrimo, the goal is making rigor visible. By using AI to create appealing visuals, we strip away complexity to focus on what matters most, which is deeper learning for every student.
- AI text-to-visuals turns ideas into diagrams or infographics.
- Customizable styles match your brand and presentation tone.
- Share anytime by exporting in various formats and a link.
- No design skills needed for presentations, teaching, or reports.
FAQs
-
What is the difference between Bloom's Taxonomy and a DOK chart?
-
Can I use Diagrimo to create a printable DOK chart?
Is there a specific DOK chart for math?
What is a DOK wheel chart used for?
-
How does a DOK flip chart help in the classroom?
Bloom's focuses on the type of thinking (verbs), while a DOK chart measures the complexity of the mental process required to complete the task.
Yes. Diagrimo allows you to input text and instantly generate a clear visual, which you can export as a printable dok chart or dok chart pdf.
Yes. A dok chart for math differentiates between basic computation (Level 1) and complex mathematical modeling or reasoning (Level 4).
A dok wheel chart is a circular visual that maps verbs and student activities to the four levels, providing a quick reference for lesson planning.
A dok flip chart is a desktop tool that gives teachers immediate access to higher level question stems, helping to increase rigor during live discussions.
